5 strategies for increasing net revenue retention

A good net revenue retention rate isn’t one universal number: it depends on your customer segment and growth goals. At 100%, revenue from existing customers is unchanged after expansion, contraction, and churn; above 100%, expansion outweighs losses. Strong mid-market SaaS businesses often target 110%-120%, while top enterprise companies may reach 125% or higher. The most effective strategies for increasing net revenue retention start with understanding which customers are ready to grow.
It’s easy to focus on a single benchmark, but the number is more useful when you understand what drives it. Net revenue retention (NRR) measures revenue retained from existing customers, including expansion. Gross retention shows how much revenue remains before expansion is counted. Both are useful signals, but they answer different questions.
This guide explains how to interpret NRR, how it differs from gross retention, and how to spot customer behavior that may signal expansion opportunities. You’ll also learn how segmentation, customer outreach, and coordinated sales and success processes can turn those signals into a more deliberate growth strategy.
Key Takeaways
- Segment customers by behavior, including feature adoption, seat use, and collaboration, to spot accounts with expansion potential.
- Track expansion, contraction, and churn together so your retention calculation reflects the full revenue movement within existing accounts.
- Use gross retention alongside net retention to distinguish revenue preserved from revenue added through expansion.
- Route at-risk accounts for timely, human follow-up and coordinate customer success and sales around clear handoffs.
- Connect retention trends to customer value and business growth to prioritize the changes most likely to strengthen revenue health.
1. Identifying expansion-ready customer cohorts through behavioral segmentation
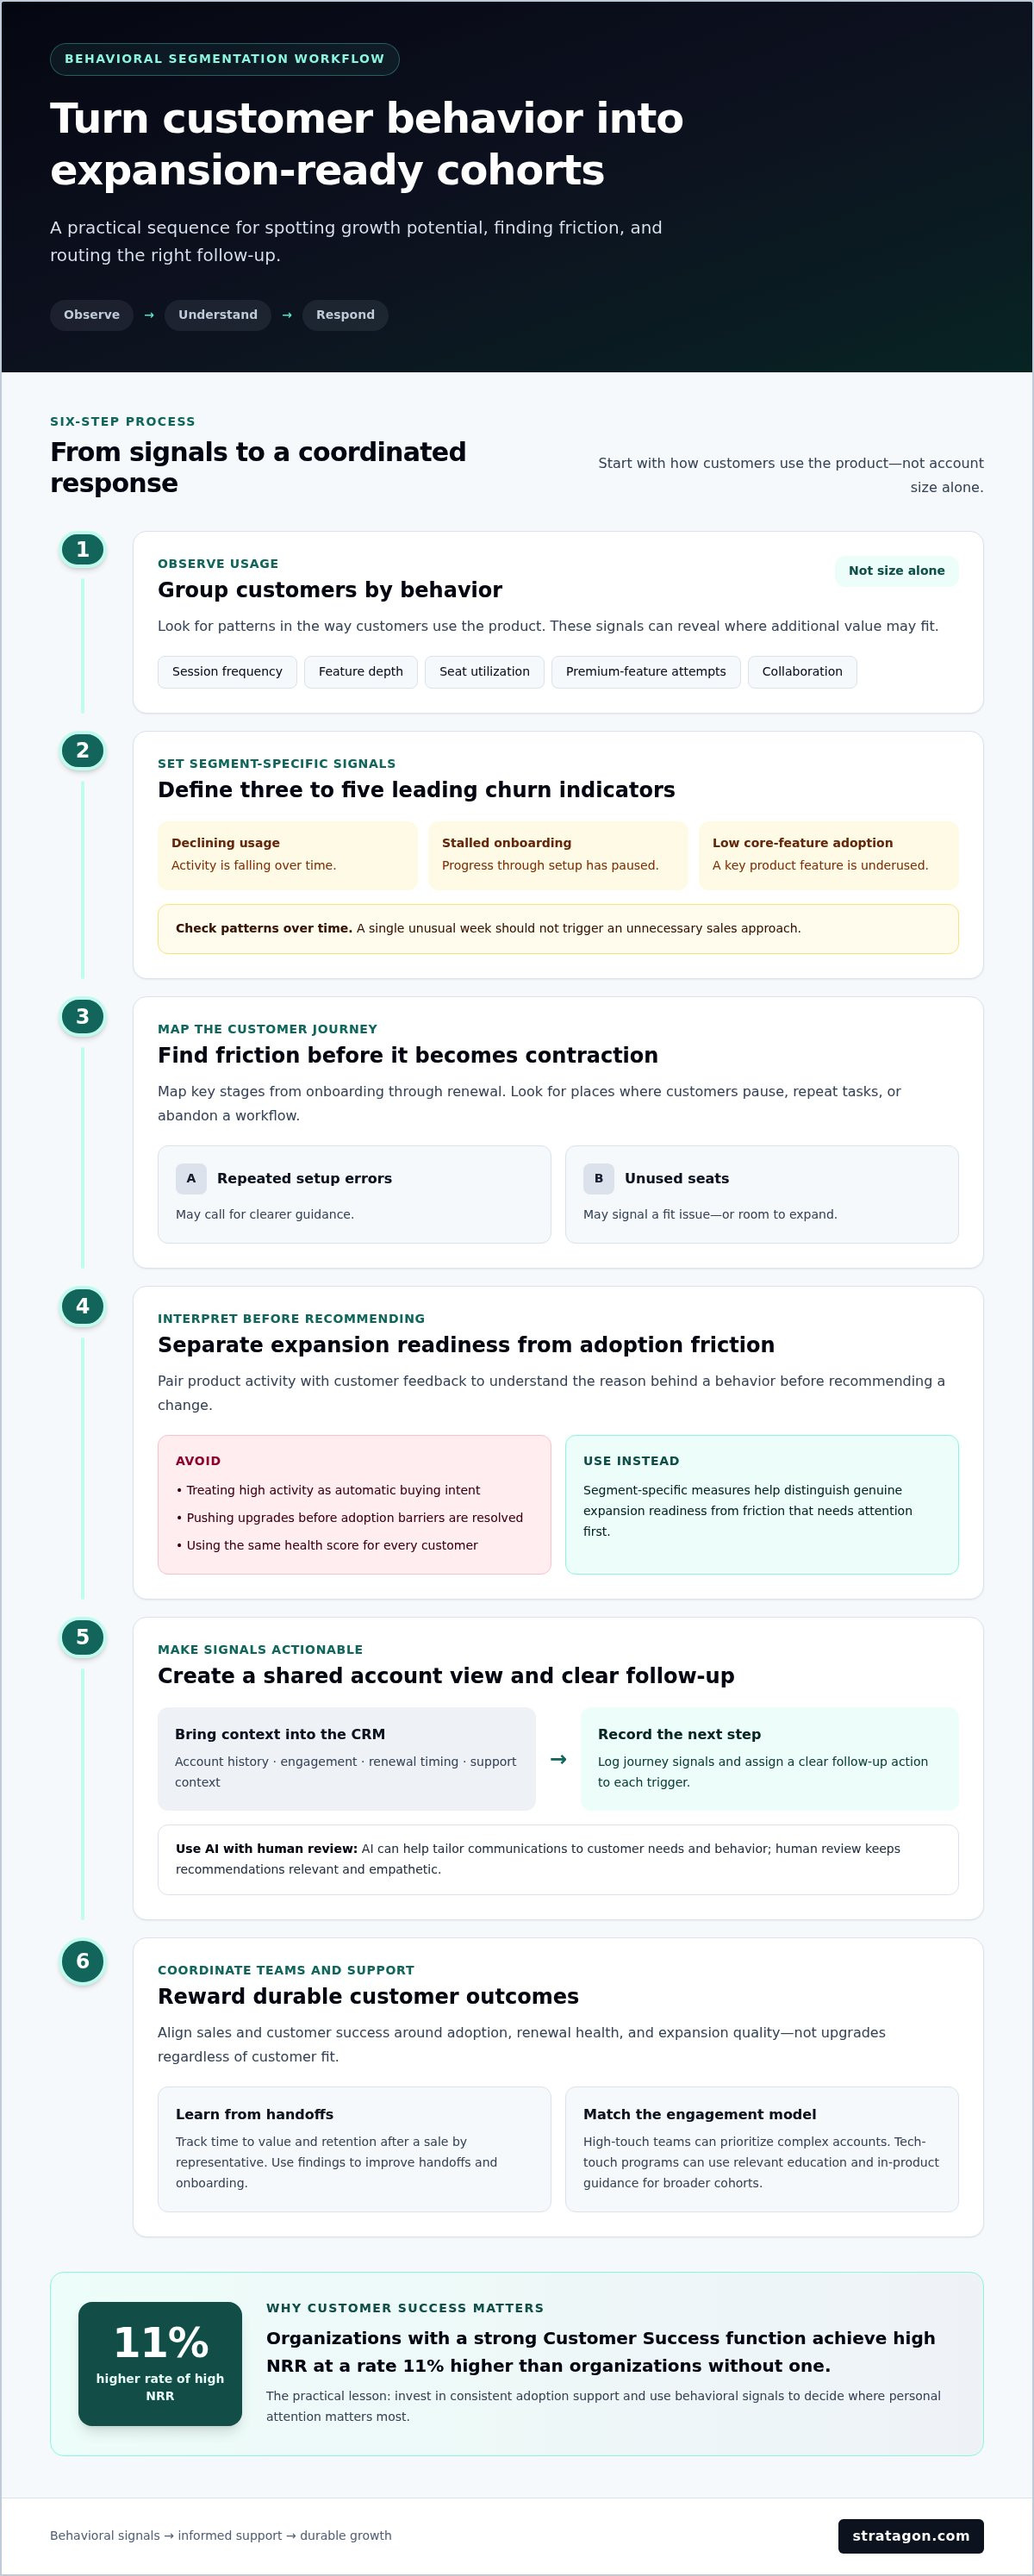
Start with customer behavior, not account size alone. Group customers by session frequency, feature depth, seat utilization, premium-feature attempts, and collaboration. These measures show how customers use the product and where additional value may fit. For each segment, define three to five leading churn indicators, such as declining usage, stalled onboarding, or low adoption of a core feature. Compare patterns over time so a single unusual week doesn’t trigger an unnecessary sales approach.
Journey analysis can reveal friction before it leads to contraction. Map key stages from onboarding through renewal, then identify where customers pause, repeat tasks, or abandon a workflow. For example, repeated setup errors may call for clearer guidance, while unused seats may indicate a fit issue or room to expand. Pair product activity with customer feedback to understand the reason behind the behavior before recommending a change.
Common mistakes include treating high activity as automatic buying intent, pushing upgrades before resolving adoption barriers, and relying on the same health score for every customer. These approaches can strain relationships and hide churn signals. Segment-specific measures help customer success teams distinguish genuine expansion readiness from friction that needs attention first.
Use a CRM to bring account history, engagement, renewal timing, and support context into a shared view. AI can help tailor communications to customer needs and behavior, while human review keeps recommendations relevant and empathetic. Define segment criteria, record journey signals in the CRM, and assign a clear follow-up action to each trigger. This creates a repeatable process rather than a one-off campaign.
Incentives shape behavior, too. Align sales and customer success goals around durable outcomes, including adoption, renewal health, and expansion quality, rather than rewarding upgrades regardless of customer fit. Track time to value and retention after a sale by representative, then use the findings to improve handoffs and onboarding. A growth-focused customer success function pairs shared measures with clear ownership across sales, service, and product teams.
Build the function around the work customers need, not a single engagement model. High-touch teams can prioritize complex accounts, while tech-touch programs use relevant education and in-product guidance for broader cohorts. Organizations with a strong Customer Success function achieve high NRR at a rate 11% higher than organizations without one. The practical lesson is to invest in consistent adoption support and use behavioral signals to decide where personal attention matters most.
2. What Is a Good Net Revenue Retention Rate?
A good NRR depends on company size, customer profile, and growth stage. SaaS Capital’s 2025 data puts median net dollar retention at 118% for enterprise SaaS companies, 108% for mid-market SaaS companies, and 97% for SMB-focused SaaS companies. Strong mid-market businesses often benchmark at 110%-120%, while top enterprise companies may reach 125% or higher. Compare like with like, rather than treating one target as universal.
Calculate NRR for a fixed customer group: add expansion revenue to its starting recurring revenue, subtract contraction and churn, then divide by starting revenue and multiply by 100. For example, a business with $200,000 in starting MRR, $30,000 in expansion revenue, and $25,000 in churn has an NRR of 102.5%. Exclude new-customer acquisition revenue so the measure reflects what existing customers retain and add.
Track each component, not just the final rate. Expansion revenue can offset churn and make NRR look healthy even when gross losses remain substantial. Record starting revenue, upgrades, downgrades, cancellations, and the customer cohort for each reporting period. Then compare cohorts by segment and lifecycle stage, such as newly onboarded, established, or approaching renewal. This helps show whether a change reflects lasting customer value or a short-lived expansion.
Churn directly lowers NRR, so teams need clear signals before renewal. Assess accounts using changes in product activity, support issues, feedback, and payment status. Define thresholds for each customer segment, then route accounts that cross them to an appropriate response. Consistently low NPS may indicate that a SaaS company is targeting the wrong ideal customer profile, making acquisition quality part of the retention diagnosis.
Not every cancellation reflects dissatisfaction. Involuntary churn can follow failed payments, so dunning optimization should make payment recovery timely and straightforward. Dunning optimization takes one to two weeks to implement, and is estimated to improve NRR by one to three points. Track recovery outcomes separately from voluntary cancellations to see whether payment processes, rather than product fit, are eroding recurring revenue.
Use targeted in-app guides when customer behavior points to a specific obstacle. A guide can respond to stalled onboarding, declining usage before renewal, or repeated errors, helping customers reach value before contraction occurs. Review guide engagement alongside adoption and renewal outcomes, since impressions alone don’t show whether a customer succeeded. Pair these measures with cohort NRR to identify which interventions help customers retain value and where the experience still creates friction.
3. Distinguishing net revenue retention from gross revenue retention
Net revenue retention (NRR) and net dollar retention describe revenue retained from existing customers, including expansion. Gross revenue retention (GRR) isolates revenue remaining after churn and contraction, before expansion is counted. To compare them, use the same customer cohort and reporting period. The difference shows how much upgrades and added usage offset cancellations or downgrades.
Use starting recurring revenue as the denominator for each measure. For GRR, subtract contraction and churn from starting revenue, then divide by that starting figure and multiply by 100. For NRR, also add expansion revenue before dividing. This calculation makes the distinction clear: GRR measures preservation, while NRR captures preservation plus growth within the existing customer base.
GRR cannot exceed 100%, because it excludes revenue expansion. A GRR of 90% or higher is described as strong, but the right interpretation depends on the customer segment and revenue mix. NRR can exceed 100% when expansion outweighs losses. Read the two measures together: strong NRR with weaker GRR can indicate that upgrades are masking churn or contraction.
Consider a cohort in which some existing customers expand their subscriptions while others cancel or downgrade. NRR may rise because expansion revenue offsets those losses, while GRR still records the revenue lost. That contrast points to different actions. If GRR weakens, investigate retention and product fit. If GRR holds but NRR lags, examine adoption paths and relevant expansion opportunities.
Gross retention has a ceiling. Once a cohort retains all its starting recurring revenue, GRR cannot show further growth, even if customers adopt more features or seats. NRR captures that additional revenue, but expansion can deliver diminishing returns if it relies on repeated upgrades without stronger customer value. Review product usage, onboarding progress, and customer feedback to determine whether expansion reflects sustained success.
Make the measures operational with a consistent review sequence. First, define the cohort and period. Next, reconcile starting revenue, churn, contraction, downgrades, and expansion. Then compare NRR with GRR across segments and customer lifecycle stages. Finally, assign a response to the largest movement, such as improving onboarding where early contraction appears or investigating renewal risks where GRR declines.
Neither measure explains the cause on its own. Pair revenue data with account-level context, including adoption milestones, support themes, and renewal status. Rising NRR alongside falling GRR calls for closer scrutiny of churn and expansion concentration. Stable GRR with improving NRR points to expansion within the customer base. This combined review helps teams choose actions based on the pattern, not a single headline figure.
4. Activating at-risk and expansion-ready segments for targeted outreach
Turn account segments into distinct outreach plays. For at-risk customers, connect a health-score decline to a specific action, such as a service review or onboarding support. Route accounts to a human within 48 hours of a threshold breach. For expansion-ready accounts, use indicators such as sustained feature adoption, growing seat use, or premium-feature attempts to guide a relevant conversation before renewal.
Account segmentation and health scores can surface expansion opportunities by combining customer fit with evidence of value. Group accounts by attributes such as use case, company profile, and lifecycle stage, then compare adoption and engagement within each group. A strong score paired with increased usage may signal expansion readiness; a low score or unresolved support issue calls for retention action first. The score directs attention, while account context shapes the conversation.
Give sales and customer success a shared view of renewal timing, product activity, open issues, and expansion opportunities. Clear handoff rules prevent duplicate outreach and keep selling connected to customer outcomes. For strategic accounts, expansion pipeline should reach at least 40% of base ARR; for growth accounts, the recommended level is 25% of base ARR. Treat these as pipeline planning targets, not reasons to pitch customers without a clear need.
Marketing can support expansion by helping customers recognize value and share successful use cases. Use customer feedback and advocacy stories to shape relevant communications, then tailor content to account needs and adoption stage. Account-Based Marketing (ABM) can coordinate messages for priority accounts, while marketing automation can deliver timely education based on customer behavior. For example, a customer exploring an advanced workflow could receive guidance that supports adoption before a sales conversation.
Usage-based pricing can connect expansion revenue to customer value when increased usage corresponds with increased customer success. Some SaaS customer groups can grow usage by as much as 10 times over the years. That potential makes usage a useful indicator, but it doesn’t make every increase an upgrade opportunity. Confirm that added usage reflects productive adoption and that the pricing model supports the customer’s value driver.
Build targeted plays around why an account is ready to act. If an account shows broad adoption but limited use of a relevant capability, provide practical education and invite a discussion about fit. If feedback points to friction, address the barrier before offering an upgrade. Review engagement, renewal status, and expansion revenue across accounts, then refine messaging with Sales, Product, and Marketing. That shared feedback loop turns outreach into a repeatable growth process.
5. Net dollar retention definition and business importance
Net dollar retention (NDR) measures how recurring revenue from existing customers changes over a set period, excluding new-customer acquisition. It captures upgrades, added usage, downgrades, contraction, and churn in one metric. A rate above 100% means the existing customer base generated more recurring revenue than it lost. Below 100%, revenue from that base declined, even if new sales increased total company revenue.
The distinction matters because acquisition can conceal a retention problem. New contracts may lift reported revenue while existing customers reduce subscriptions or leave. NRR separates those effects, giving leadership a clearer view of customer value and revenue durability. Use it alongside acquisition and new-sales measures, rather than treating either source of growth as a substitute for the other.
Treat NRR as an outcome metric, not a diagnosis. It’s a lagging indicator of how well an organization delivers value across the business, reflecting customer behavior that has already occurred. Analyze its components by cohort, product, and lifecycle stage to find the causes. If adoption rises before upgrades, strengthen the customer journey that supports adoption; if downgrades precede renewal, investigate the unmet need behind them.
The metric also helps leadership assess how expansion contributes to growth. SaaS companies with NRR above 110% grow revenue 2.5 times faster than low-NRR peers. That comparison makes the customer base strategically important: successful adoption and relevant upgrades can compound revenue without relying solely on acquisition. It doesn’t mean every customer should receive an upgrade pitch. Expansion should follow demonstrated value and a customer need.
A 120% net revenue retention rate could double a business in five years without adding new customers, using a $10 million starting ARR example. Treat that as a model of compounding, not a forecast for every company. The practical use is to test how retention changes affect the growth plan, then identify which customer behaviors support durable expansion. Track the trend across periods and connect movement to specific improvements in onboarding, adoption, or customer experience.
Retention also carries a profitability implication. Forrester reports that a 5% increase in retention rates can lead to a 25% increase in profitability. Use this relationship to make retention analysis relevant beyond customer success: Finance can model revenue effects, Product can address adoption barriers, and Marketing can reinforce customer value. A shared review turns a metric into coordinated action.
If your team needs to connect customer experience, adoption, and revenue priorities, explore strategic marketing services as a next step.
Stratagon: HubSpot CRM Implementation
Stratagon helps organizations build a clearer operational foundation for customer retention through HubSpot CRM Implementation. This is a useful next step when customer, sales, and renewal information sits across disconnected processes, making it harder to act on churn signals or coordinate expansion conversations.
A well-structured CRM gives teams a shared view of account activity, customer needs, and follow-up responsibilities. Stratagon also supports digital transformation, Sales Enablement, and Account-Based Marketing (ABM), helping align the systems and teams involved in customer growth. Start by identifying where your current process creates the most friction, whether in data visibility, sales handoffs, or targeted engagement.
Contact Stratagon to discuss your retention priorities and how a practical CRM approach can support them.
Turn retention insights into a coordinated growth plan
Retention becomes a strategic advantage when teams translate analysis into clear ownership. Decide which customer behaviors deserve attention, who responds, and how Sales, Marketing, and Customer Success share what they learn. That operating rhythm keeps improvement focused on customer value rather than isolated metric changes. The most effective strategies for increasing net revenue retention connect customer experience to decisions across the organization.
Stratagon supports that alignment through HubSpot CRM Implementation and digital transformation, helping bring customer and revenue processes into a more coherent operating model. Account-Based Marketing (ABM) can also help teams coordinate relevant engagement around priority accounts. Identify where your current processes make retention insights difficult to act on, then shape a plan around that constraint.
Start a conversation about your retention priorities and explore a practical path toward stronger customer relationships and sustainable growth.
Frequently Asked Questions
What Is a Good Net Revenue Retention Rate?
A good NRR depends on your customer segment, but a rate above 100% means existing-customer revenue grew after losses. For a practical target, compare your result with companies serving similar customers and selling similar subscription plans. Then review the underlying causes: a strong rate driven by broad product adoption is more durable than one reliant on a few large upgrades. Track the trend alongside renewal and customer health measures.
Can Early-Stage Startups Focus on NRR?
Yes. Early-stage startups can begin tracking NRR once they have recurring revenue from existing customers, while interpreting small cohorts carefully. One large account expansion can move the rate sharply when the customer base is small. Pair NRR with customer interviews, onboarding progress, and renewal outcomes to understand the pattern. Early analysis can reveal whether the product delivers repeatable value before expansion becomes a central growth lever.
How do you prioritize these levers?
Prioritize the lever tied to the largest preventable revenue loss or clearest customer need. First, separate churn, contraction, and expansion in the calculation. Then examine account evidence: failed payments may point to dunning improvements, while low adoption may call for onboarding or product guidance. Assign an owner and review results for the same customer segment. This keeps teams from pursuing upgrades when retention problems need attention first.
Is 100% NDR good?
Yes, 100% NDR means revenue from existing customers is unchanged after expansion and losses balance out. It signals stability, not growth from the existing base. A company relying on new-customer acquisition may still grow overall, but this rate shows that current customers aren’t adding net revenue. To interpret the result, inspect customer-level changes: flat NDR could reflect steady renewals or expansion that merely offsets cancellations and downgrades.
What is a good NDR benchmark in 2026?
For 2026 planning, compare your performance with the latest segment-specific data available in this article. SaaS Capital’s 2025 data reports median net dollar retention of 118% for enterprise SaaS, 108% for mid-market SaaS, and 97% for SMB-focused SaaS companies. These figures are reference points, not universal goals. Differences in customer profile, product maturity, and expansion model affect what a realistic improvement target looks like.
What is a good NRR?
A good NRR exceeds 100%, showing that expansion among existing customers outweighs revenue lost through churn and contraction. The right target depends on customer segment and business model, so assess your performance against relevant peers rather than a single universal threshold. Also examine how the rate changes over time. A consistent result across customer cohorts gives leadership a more useful signal than a one-period increase caused by a single account.
What is net dollar retention and why does it matter?
Net dollar retention measures the change in recurring revenue from a defined group of existing customers, excluding new-customer revenue. It matters because it separates the health of the current customer base from acquisition performance. Finance teams can use it to understand revenue durability, while customer-facing teams investigate what changed within accounts. A rising result alongside weaker renewals, for example, may call for a closer look at expansion concentration.
What is the fastest way to improve NDR?
Start with the clearest fix in your revenue data rather than applying one play to every account. If failed payments drive losses, dunning optimization takes one to two weeks to implement and is estimated to improve NRR by one to three points. If adoption is the issue, address the specific friction customers encounter before offering upgrades. Compare outcomes by intervention and cohort to see which action strengthens recurring revenue sustainably.