Ways to reduce B2B customer churn rate through feedback

The right churn-measurement window can be as important as the retention tactic. To understand how to reduce the B2B customer churn rate, measure over a period that fits your sales cycle: it shouldn’t be shorter than the average cycle, twice that cycle is a suitable window, and the period generally shouldn’t exceed one year.
Customer feedback matters, but collecting it alone won’t protect revenue. Teams need to spot recurring friction, respond to customer concerns, and connect what they hear to practical retention measures.
This article explains how to turn feedback into action, recognize signs of churn risk, and align measurement with the sales cycle. You’ll learn how to distinguish customer loss from revenue contraction, choose useful signals to monitor, and give retention efforts enough time to show whether they’re working. The result is a clearer, more coordinated approach to keeping B2B relationships on track.
Key Takeaways
- Collect feedback through surveys and conversations, then close the loop by addressing recurring service issues and sharing what changed.
- Calculate customer churn by dividing accounts lost during a period by the number at the period’s start, then multiply by 100.
- Track customer lifetime value alongside net revenue retention to see how cancellations, downgrades, and expansion affect revenue from existing accounts.
- Choose a churn-measurement period that reflects your sales cycle so retention trends are meaningful and teams have time to act on them.
1. Customer feedback and identifying service weaknesses
Teams asking how to reduce the B2B customer churn rate should start with specific questions after meaningful customer interactions. For example, ask, “What made this process harder than expected?” A survey found that 73% of consumers want to leave feedback after customer service interactions. Yet only 1 in 26 unhappy customers will complain, so silence doesn’t prove a healthy customer experience. Invite responses through short surveys and interviews with highly engaged and less engaged accounts.
Next, categorize comments by cause, such as onboarding friction, slow support, unclear value, or a missing integration. Compare those themes with satisfaction measures and account behavior. NPS responses use a 0-to-10 scale, with scores from 0 through 6 classified as detractors. Treat each score as a signal, then review comments and speak with customers to understand the reasons behind it.
How should businesses improve B2B customer onboarding and time to value? Align sales promises with implementation steps, clarify the first expected outcome, and give each account a roadmap through relevant features and processes. This helps customers understand what happens next and when they can expect to realize value.
Product usage data adds context to feedback. Compare account activity over time, watch for declining use of important features, and connect those changes to survey responses or support concerns. A drop in engagement can flag an account for a timely conversation before renewal discussions begin. Knowing how to reduce the B2B customer churn rate depends on turning these signals into timely, accountable follow-up.
Use recurring customer problems to prioritize improvements. If several accounts report the same integration barrier, assess how widely it affects adoption and whether a product change would address the underlying issue. Assign an owner and a next step to each priority instead of treating every comment as an equal development request.
Close the loop by telling customers what you heard, what action the team will take, and what happens next. Companies that close the loop on all customer feedback see an 8.5% increase in retention, three times more promoters, and an 11-point increase in NPS. This feedback-to-action process helps support, product, and sales teams apply customer experience insights.
2. How Do You Reduce Customer Churn?
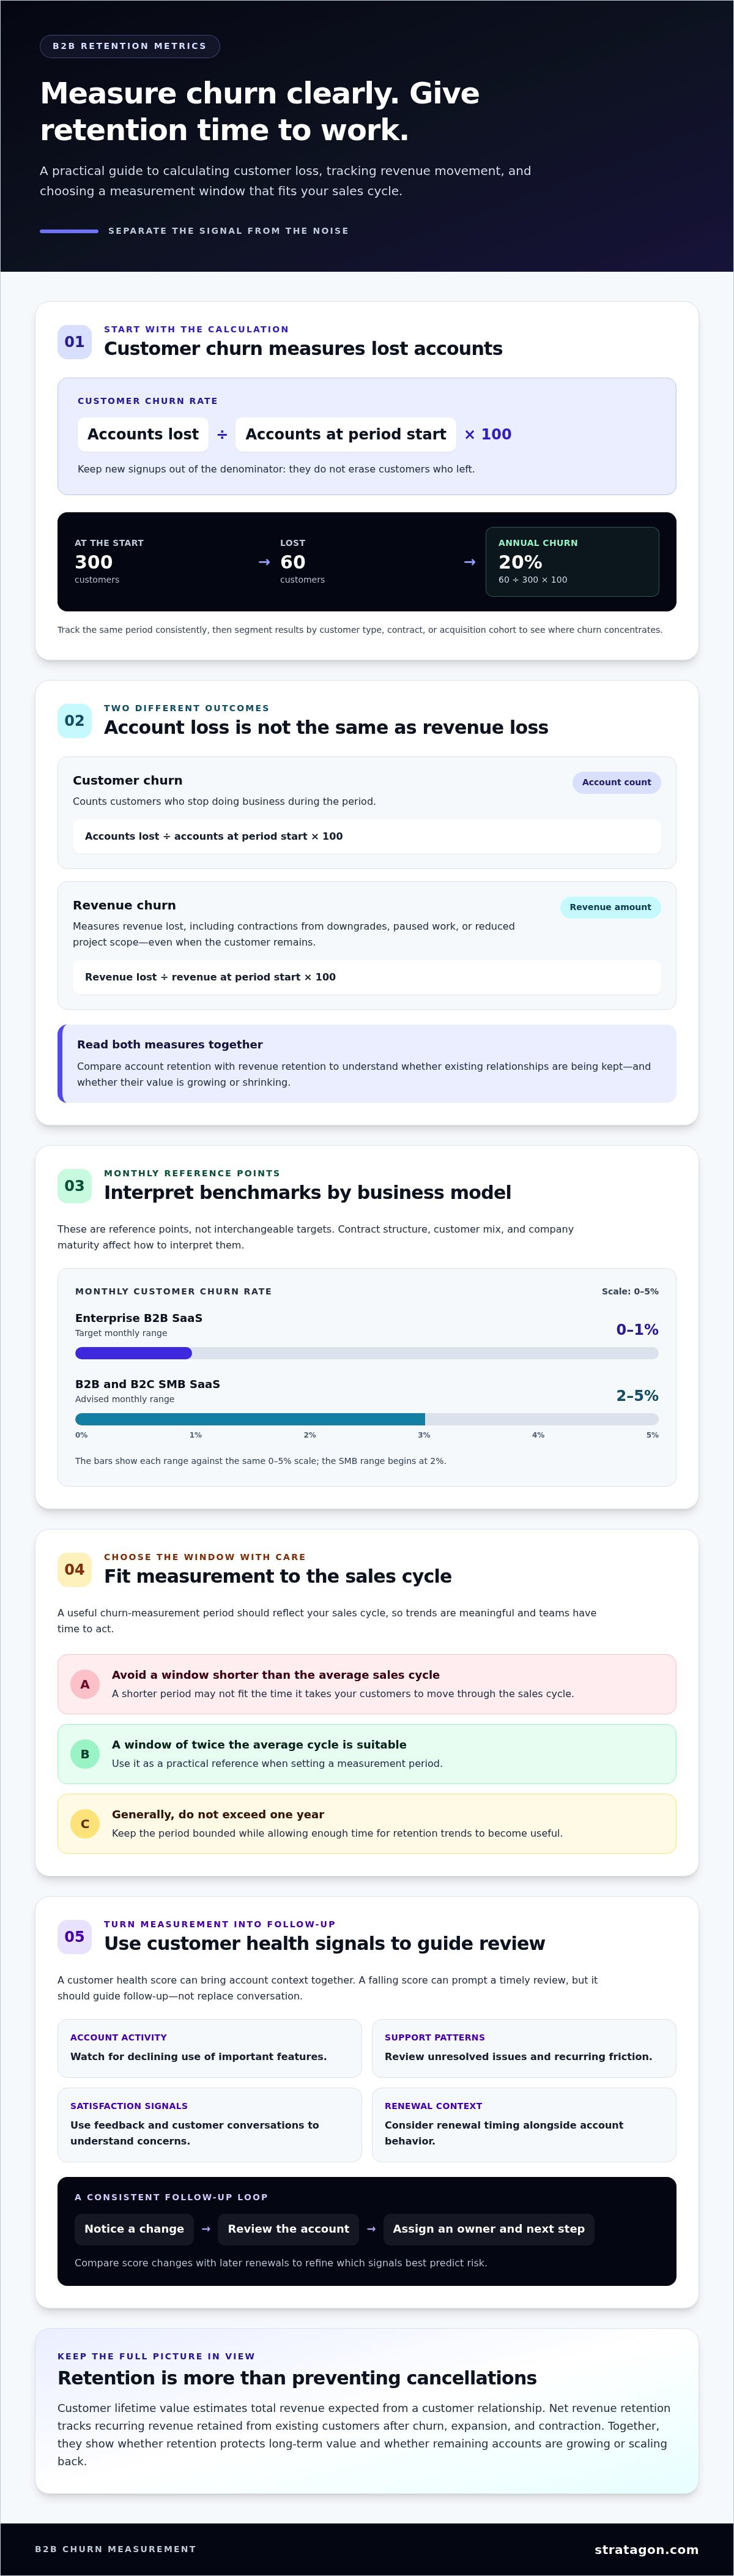
Customer churn is the share of customers who stop doing business during a defined period. Count lost accounts, divide by the number at the period’s start, then multiply by 100. Keep new signups out of the denominator; they don’t erase customers who left.
For example, a company that begins the year with 300 customers and loses 60 has a 20% annual churn rate: 60 ÷ 300 × 100. Track the same period consistently, then segment results by customer type, contract, or acquisition cohort. Those cuts can show whether churn concentrates in a particular group.
Revenue churn measures a different outcome. Divide revenue lost during the period by revenue at its start, then multiply by 100. A customer may remain but downgrade, pause, or reduce a project, creating revenue churn without customer churn. Compare both measures to see whether loyalty and customer satisfaction are translating into retained accounts and revenue.
Benchmark only against businesses with comparable models and periods. Enterprise B2B SaaS companies have a target monthly customer churn rate of 0-1%, while B2B and B2C SMB SaaS businesses are advised to aim for 2-5% monthly. These are reference points, not interchangeable targets; contract structure, customer mix, and company maturity affect interpretation.
How can customer health scores predict B2B churn? Combine account activity, support patterns, satisfaction signals, and renewal context into a consistent score. A falling score can prompt a timely review, helping teams connect a change in customer behavior with an action before renewal.
Use the score to guide follow-up, not replace conversation. For example, sales or customer success teams can review accounts with declining usage, unresolved support issues, or weaker engagement, then assign an owner and a next step. Compare score changes with later renewals to refine which signals best predict risk. This creates a practical feedback loop between customer health, satisfaction, and retention.
3. Customer lifetime value and net revenue retention
Customer lifetime value (CLV) estimates the total revenue a business can expect from a customer relationship. Use it alongside net revenue retention (NRR), which tracks recurring revenue retained from existing customers after churn, expansion, and contraction. Together, these measures show whether retention protects long-term value and whether remaining accounts are growing or scaling back.
Revenue churn can appear before a customer cancels. An account may reduce its project scope or downgrade while remaining active. Track those contractions alongside cancellations, renewals, and expansion so teams can distinguish a stable relationship from one losing value.
Build retention strategies around why an account may leave. If engagement falls because the solution isn’t delivering expected value, coordinate a response across sales, service, and product teams. If budget pressure threatens renewal, a tailored discount may help, but it should not replace a clear explanation of the value delivered.
How should B2B companies segment accounts and prioritize retention efforts? Group accounts by profitability, renewal risk, engagement, and growth potential, then prioritize profitable customers showing credible churn signals. This directs retention resources toward relationships where a timely intervention can protect meaningful value.
Shared customer-retention goals can reinforce that focus across the company. For example, align sales, account management, and service around renewal health, customer outcomes, and accurate handoffs. For small and mid-sized businesses that need experienced strategic guidance to unite these functions, fractional marketing leadership from Budget Boosters can help align lifecycle retention with revenue goals. Review incentives to ensure they reward lasting engagement and renewal quality, not just short-term contract closure.
How do you measure the ROI of B2B churn reduction programs? Compare the incremental retained and expanded revenue associated with the program against its costs, using a consistent period and customer cohort. A simple calculation is (incremental benefit minus program cost) divided by program cost. Include renewal outcomes and revenue contractions to assess whether the solution improved retention, not merely delayed cancellations.
4. Choosing a measurement period based on sales cycles
A churn measure only helps when its window reflects how B2B relationships develop. If the period is shorter than the average sales cycle, renewals and customer outcomes may not have time to appear. Use twice the average sales cycle as a suitable measurement period, and generally keep the window within one year.
A software company with a long evaluation and contracting process, for example, may see a new customer pass through several stages before renewal. A brief monthly view can flag immediate changes, but it shouldn’t stand alone as the main retention measure. Pair short-term indicators with a period long enough to capture the customer journey.
Choose the period by mapping key milestones: initial commitment, onboarding, first value, adoption, and renewal. Then compare churn across equivalent customer groups and contract stages. This helps separate a genuine shift in retention from timing effects, such as one group reaching subscription renewal later than another.
Keep the method consistent as you assess changes. If onboarding or software updates change, note when they took effect and compare customer groups with similar sales-cycle patterns. Major improvements based on feedback may take 3–6 months to produce a meaningful, sustained reduction in overall churn. Review early indicators during that time, but judge the broader outcome over a fitting measurement window.
For a useful measure, connect the sales cycle to the business model, contract structure, and customer behavior. Sales Enablement can align sales handoffs with the customer journey, while Account-Based Marketing (ABM) can support coordinated account engagement. Together, these practices help teams build a more consistent view of relationship health and retention.
Stratagon: HubSpot CRM Implementation
Stratagon helps B2B teams connect customer insights with the systems and processes that support retention. Its HubSpot CRM Implementation can help organize customer information and align sales and marketing workflows, giving teams a clearer foundation for coordinating account engagement.
Consider this approach when feedback, renewal planning, and account activity are difficult to coordinate across teams. Digital transformation can support broader process alignment, while Account-Based Marketing (ABM) and Sales Enablement can help teams coordinate communication around priority accounts. The right approach depends on where the customer journey breaks down and which teams need to act on the same signals.
To explore how Stratagon can support your retention strategy, contact Stratagon.
Build retention into your next growth cycle
Lasting retention depends on treating customer insight as an operating input, not a periodic report. Give teams a shared way to turn what they learn into decisions, assign ownership, and review whether those decisions improve the customer relationship. This discipline helps your organization adapt as buyer priorities and account needs change.
As you decide how to reduce the B2B customer churn rate, focus on making retention part of how teams plan and work together. Sales, marketing, and customer-facing teams should understand their roles in sustaining value, while leadership keeps customer outcomes connected to broader growth priorities. A consistent approach makes it easier to learn from each renewal cycle and strengthen the next one.
Stratagon can help connect customer-centered strategy with the systems and processes that support it. Contact Stratagon to discuss retention and define a practical next step for your organization. Stronger customer relationships can become a foundation for confident, sustainable growth.
Frequently Asked Questions
How Do You Reduce Customer Churn?
Reduce churn by acting on account-level warning signs before customers decide to leave. When a renewal owner changes, for example, schedule a transition meeting, confirm the new stakeholder’s priorities, and document agreed outcomes. Assign one team member to coordinate follow-up across sales and service. This keeps decisions visible and prevents customers from having to repeat concerns to multiple departments.
Wait, What is Churn Rate?
Churn rate is the share of customers or revenue lost during a defined period. It helps leadership distinguish account departures from shrinking relationships. For example, a customer who downgrades remains active but generates less revenue. Track customer churn and revenue churn separately, then review both alongside renewal outcomes to see whether retention is protecting the customer base and its value.
Should I Offer Discounts to Prevent Churn?
Offer a renewal discount only when price is the customer’s central concern and the relationship remains strategically sound. First, identify whether the issue is budget, unmet expectations, limited adoption, or service friction. A discount won’t resolve those underlying problems. If price is the blocker, define the renewal terms clearly and assess whether the revised agreement supports a sustainable customer relationship.
What causes customer retention rates to drop suddenly?
A sudden decline can follow a change that affects several accounts at once, such as a service issue, shifting customer priorities, or the loss of an internal advocate. Check whether cancellations cluster by renewal date, account segment, or customer journey stage. Then compare customer comments with account activity and contract changes. This can help distinguish a broad operational problem from isolated departures.
What is a good B2B customer churn rate by industry and company size?
There’s no single benchmark that fits every B2B company. Enterprise SaaS businesses have a target monthly customer churn rate of 0-1%, while SMB SaaS businesses are advised to aim for 2-5% monthly. Annual industry examples also vary: SaaS rates are reported at 10%–14%, office supplies at 24%, and telecommunications at 31%. Compare like periods and business models.
How do you calculate B2B customer churn, retention, and net revenue retention?
Calculate customer churn as lost customers divided by starting customers, multiplied by 100. For customer retention, subtract new customers from the ending count, divide by starting customers, then multiply by 100. Calculate net revenue retention by adding expansion revenue to starting recurring revenue, subtracting churned and contracted revenue, then dividing by starting recurring revenue and multiplying by 100. Use the same period throughout.